# S3 method for class 'rulelist'
prune(
  tree,
  metrics_to_exclude = NULL,
  stop_expr_string = "relative__cumulative_coverage >= 0.9",
  min_n_rules = 1,
  ...
)
Arguments
- tree
A rulelist
- metrics_to_exclude
(character vector or NULL) Names of metrics not to be calculated. See calculate for the list of default metrics.
- stop_expr_string
(string default: "relative__cumulative_coverage >= 0.9") Parsable condition
- min_n_rules
(positive integer) Minimum number of rules to keep
- ...
Named list of custom metrics passed to calculate
Value
Object of class 'prune_ruleslist' with these components: 1. pruned: ruleset keeping only first 'pos' rows. 2. n_pruned_rules: pos. If stop criteria is never met, then pos = nrow(ruleset) 3. n_total_rules: nrow(ruleset), 4. metrics_df: Dataframe with metrics and relative metrics 5. stop_expr_string
Details
Metrics are computed using calculate. 2. Relative metrics (prepended by 'relative__') are calculated by dividing each metric by its max value. 3. The first rule in rulelist order which meets the 'stop_expr_string' criteria is stored (say 'pos'). Print method suggests to keep rules until pos.
Examples
library("magrittr")
model_c5  = C50::C5.0(Attrition ~., data = modeldata::attrition, rules = TRUE)
tidy_c5   = tidy(model_c5) %>%
            set_validation_data(modeldata::attrition, "Attrition") %>%
            set_keys(NULL)

#' prune with defaults
prune_obj = prune(tidy_c5)
#' note that all other metrics are visible in the print output
prune_obj
#> ── Prune Suggestion ────────────────────────────────────────────────────────────
#>
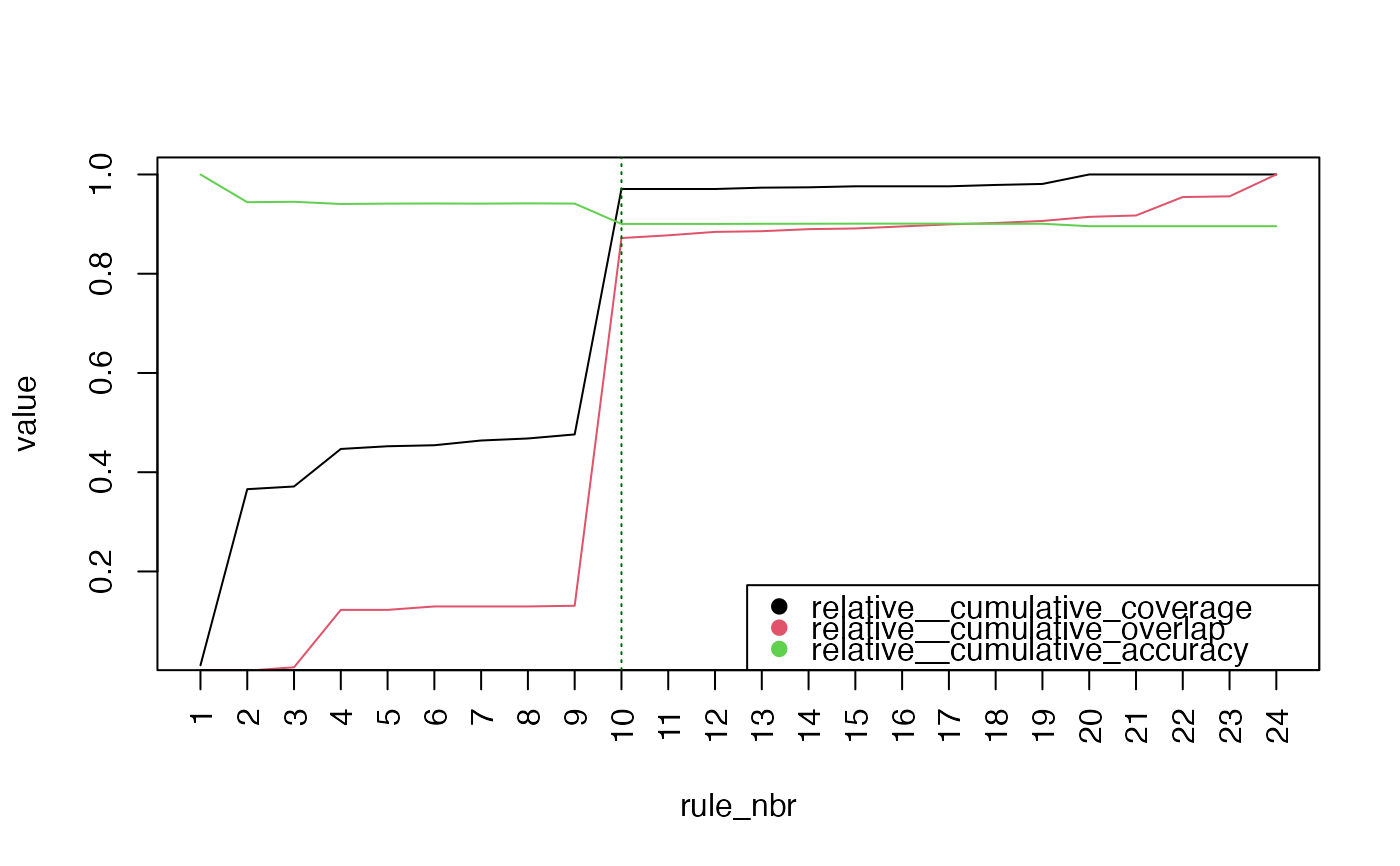
#> ✔ Keep first 10 out of 24
#>
#> ℹ Metrics after 10 rules:
#> # A tidytable: 6 × 3
#>   rule_nbr metric                           value
#>      <int> <chr>                            <dbl>
#> 1       10 cumulative_coverage           1425
#> 2       10 cumulative_overlap             633
#> 3       10 cumulative_accuracy              0.900
#> 4       10 relative__cumulative_coverage    0.971
#> 5       10 relative__cumulative_overlap     0.872
#> 6       10 relative__cumulative_accuracy    0.900
#>
#> ℹ Run `plot(x)` for details; `x$pruned` to get pruned rulelist
#> ────────────────────────────────────────────────────────────────────────────────
plot(prune_obj)

prune_obj$pruned
#> ---- Rulelist --------------------------------
#> ▶ Keys: NULL
#> ▶ Number of rules: 10
#> ▶ Model type: C5
#> ▶ Estimation type: classification
#> ▶ Is validation data set: TRUE
#>
#>
#>    rule_nbr trial_nbr LHS                         RHS   support confidence  lift
#>       <int>     <int> <chr>                       <fct>   <int>      <dbl> <dbl>
#>  1        1         1 ( JobLevel <= 1 ) & ( Mont… Yes        16      0.944   5.9
#>  2        2         1 ( EnvironmentSatisfaction … No        521      0.941   1.1
#>  3        3         1 ( DailyRate <= 722 ) & ( J… Yes        13      0.933   5.8
#>  4        4         1 ( JobRole == 'Research_Sci… No        195      0.924   1.1
#>  5        5         1 ( EnvironmentSatisfaction … Yes         9      0.909   5.6
#>  6        6         1 ( EnvironmentSatisfaction … Yes         9      0.909   5.6
#>  7        7         1 ( JobRole %in% c('Laborato… Yes        14      0.875   5.4
#>  8        8         1 ( JobRole == 'Laboratory_T… Yes         6      0.875   5.4
#>  9        9         1 ( Department == 'Sales' ) … Yes        13      0.867   5.4
#> 10       10         1 ( TotalWorkingYears > 2 )   No       1347      0.864   1
#> ----------------------------------------------

#' prune with a different stop_expr_string threshold
prune_obj = prune(tidy_c5,
                  stop_expr_string = "relative__cumulative_coverage >= 0.2"
                  )
prune_obj #' as expected, has smaller then 10 rules as compared to default args
#> ── Prune Suggestion ────────────────────────────────────────────────────────────
#>
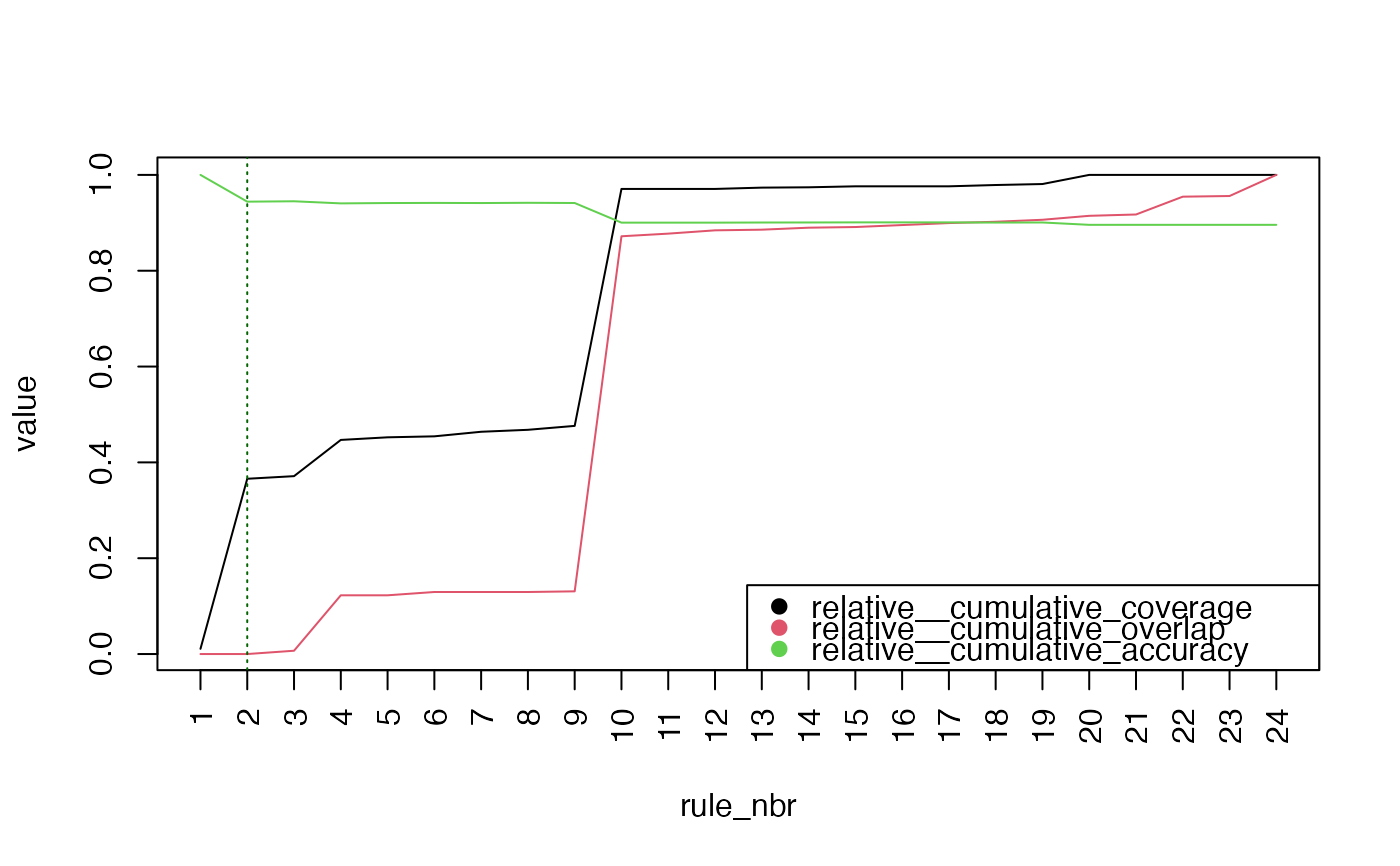
#> ✔ Keep first 2 out of 24
#>
#> ℹ Metrics after 2 rules:
#> # A tidytable: 6 × 3
#>   rule_nbr metric                          value
#>      <int> <chr>                           <dbl>
#> 1        2 cumulative_coverage           537
#> 2        2 cumulative_overlap              0
#> 3        2 cumulative_accuracy             0.944
#> 4        2 relative__cumulative_coverage   0.366
#> 5        2 relative__cumulative_overlap    0
#> 6        2 relative__cumulative_accuracy   0.944
#>
#> ℹ Run `plot(x)` for details; `x$pruned` to get pruned rulelist
#> ────────────────────────────────────────────────────────────────────────────────
plot(prune_obj)

prune_obj$pruned
#> ---- Rulelist --------------------------------
#> ▶ Keys: NULL
#> ▶ Number of rules: 2
#> ▶ Model type: C5
#> ▶ Estimation type: classification
#> ▶ Is validation data set: TRUE
#>
#>
#>   rule_nbr trial_nbr LHS                          RHS   support confidence  lift
#>      <int>     <int> <chr>                        <fct>   <int>      <dbl> <dbl>
#> 1        1         1 ( JobLevel <= 1 ) & ( Month… Yes        16      0.944   5.9
#> 2        2         1 ( EnvironmentSatisfaction %… No        521      0.941   1.1
#> ----------------------------------------------

#' prune with a different stop_expr_string metric
st = "relative__cumulative_overlap <= 0.7 & relative__cumulative_overlap > 0"
prune_obj = prune(tidy_c5, stop_expr_string = st)
prune_obj #' as expected, has smaller then 10 rules as compared to default args
#> ── Prune Suggestion ────────────────────────────────────────────────────────────
#>
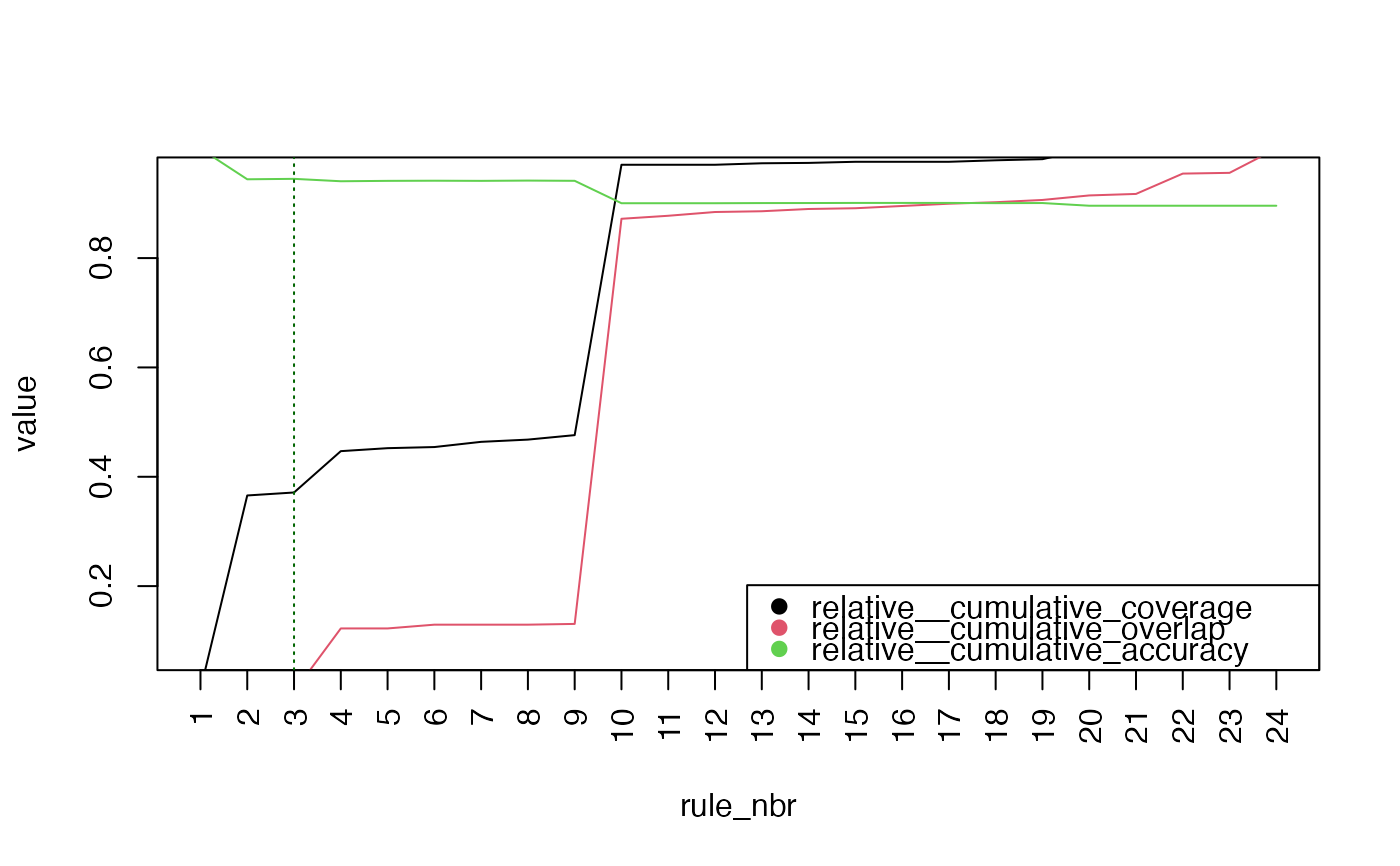
#> ✔ Keep first 3 out of 24
#>
#> ℹ Metrics after 3 rules:
#> # A tidytable: 6 × 3
#>   rule_nbr metric                            value
#>      <int> <chr>                             <dbl>
#> 1        3 cumulative_coverage           545
#> 2        3 cumulative_overlap              5
#> 3        3 cumulative_accuracy             0.945
#> 4        3 relative__cumulative_coverage   0.371
#> 5        3 relative__cumulative_overlap    0.00689
#> 6        3 relative__cumulative_accuracy   0.945
#>
#> ℹ Run `plot(x)` for details; `x$pruned` to get pruned rulelist
#> ────────────────────────────────────────────────────────────────────────────────
plot(prune_obj)

prune_obj$pruned
#> ---- Rulelist --------------------------------
#> ▶ Keys: NULL
#> ▶ Number of rules: 3
#> ▶ Model type: C5
#> ▶ Estimation type: classification
#> ▶ Is validation data set: TRUE
#>
#>
#>   rule_nbr trial_nbr LHS                          RHS   support confidence  lift
#>      <int>     <int> <chr>                        <fct>   <int>      <dbl> <dbl>
#> 1        1         1 ( JobLevel <= 1 ) & ( Month… Yes        16      0.944   5.9
#> 2        2         1 ( EnvironmentSatisfaction %… No        521      0.941   1.1
#> 3        3         1 ( DailyRate <= 722 ) & ( Jo… Yes        13      0.933   5.8
#> ----------------------------------------------