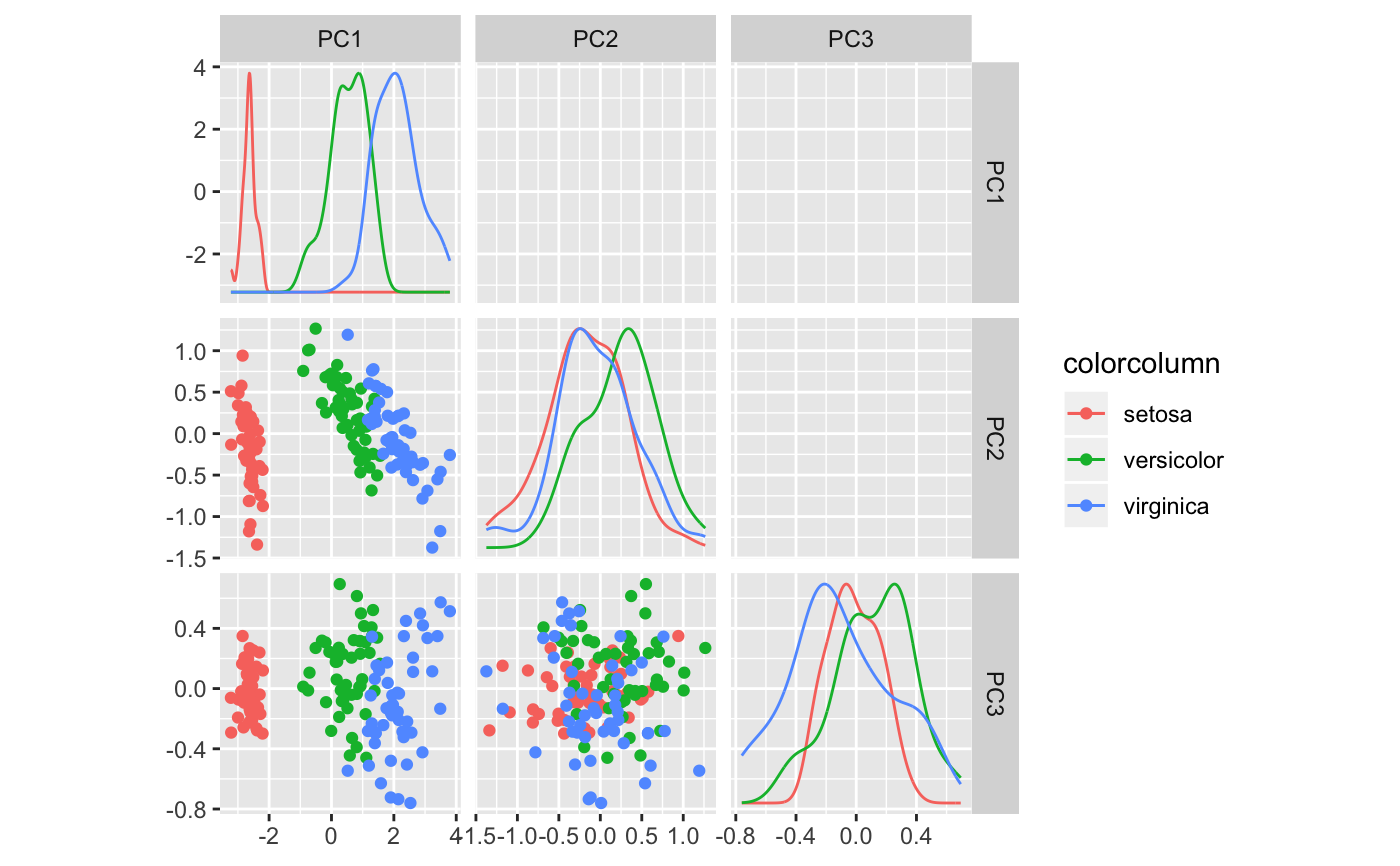
Plot a few principal components
pcaPlot.RdPlot a few principal components against each other, their densities colored by some factor
pcaPlot(model, rank = 3, color)
Arguments
| model | A 'prcomp' model |
|---|---|
| rank | Number of first principal components to select |
| color | A factor to color by |
Value
Plots as a side effect